Hollywood, we got a problem
Paramount Skydance is paying $81B for Warner Bros Discovery’s equity ($110B subtracting the debt): a 147% premium over market. Disney paid 36% for Fox. Microsoft paid 45% for Activision. Skydance paid 48% for Paramount itself. Nothing in modern media M&A is priced like this.
A 147% premium can only mean one of three things: management is getting scammed, the asset is deeply distressed, or the situation is strategically unique. Obviously a bunch of soverignty funds and all those investors are not that stupid, and that a distressed asset typically clear at 50-80%, not in the hundreds.
This leaves us only option 3. Let’s figure out why.
Classic explanation
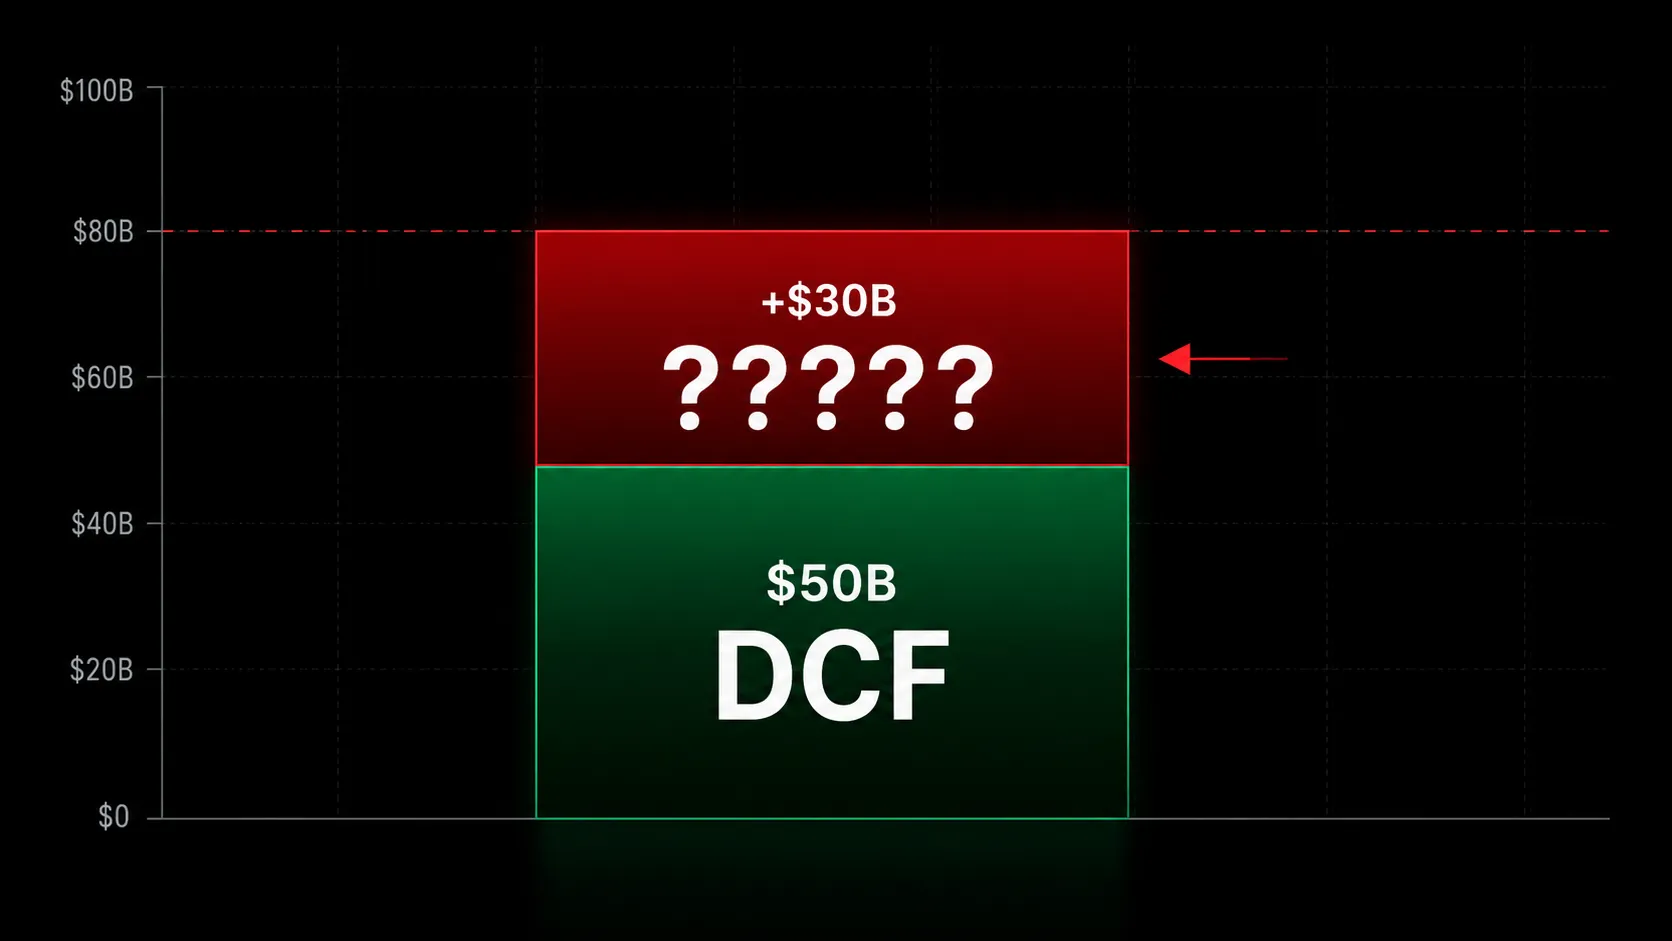
D-curve middle bulge (Parrot 86.7% cross-platform behavioral affinity), S-curve shifts down (single ERP, single tech stack, procurement, real estate):
Run the DCF and it gives a $50B total synergy. The number is approximately right… But it’s just too small, it doesn’t explain the willingness. Why?
The math ain’t mathing… what now?
Standard M&A math assumes the market sits still while you measure it. DCF a standalone trajectory, difference the synergy against it, done. But the moment you enter a market you change it. Competitors respond, capital reprices, analysts reframe, the trajectory you were measuring isn’t the trajectory anymore. There’s no term in the model for the observer’s own impact on the system being observed.
Looking for a tool that handles this, the strategy literature gives us Sutton 1991, endogenous sunk cost. Firms escalate fixed investment against each other, each round resets the threshold, the system converges to a fixed point of its own recursion. Sutton is rigorous, mathematical, well-established. This paper runs on it.
Zoom out, Sutton’s work is one slice of a much bigger pattern. From first principles, this is a recursive system: observer inside the system, every action reshaping the field every other action is taken on, is what second-order cybernetics has been describing since the 1970s. The puzzle pieces in the strategic research are coming together!
Sutton’s model works, kinda
| Sutton 1991 | |
|---|---|
| Question | Why do some markets stay concentrated as they grow? |
| Mechanism | Firms compete on quality. Quality requires fixed investment (advertising, R&D, content). Each round of investment raises the threshold the next round has to clear. |
| Result | Market growth gets absorbed into higher investment per firm, not more firms. Concentration converges to a stable lower bound. |
| Observed pattern | Largest firms grow. Mid-sized firms get squeezed out. Small niche players can survive in separate segments. |
| Scope | Firms inside one industry. Market size is taken as given. |
Content spend is the endogenous sunk cost: sunk regardless of subscriber count. This cost is quality-driving and escalating.
- Industry content investment went from $140B in 2020 to $210B in 2024.
- Market grew massively through cord-cutting and global expansion. Concentration tightened, not fragmented.
- Mid-sized players died exactly as Sutton predicts: Quibi ($1.75B raised, 500K subs, dead in six months), CNN+ ($300M, under 50K subs, dead in three weeks).
- Small niches survive in separate segments: Crunchyroll, BritBox, Mubi. Netflix scaled investment from $3B in 2014 to $18B in 2025.
Leader’s spend rising with market size, literally same as my boy Sutton predicted. The industry is converging toward a 4–5 firm lower bound. The theory is perfect for this case! Yippee!
Then you notice the drip marks.
Apple stayed but stopped competing. Content spend cut from $5B to $4.5B in 2024, Cook publicly questioning $200M productions. Inside Sutton you match the threshold or you exit - Apple did neither. Maybe Tim Apple is just having too much money and that never cared about the tiny loss?
The biggest thing on American TV screens isn’t a streaming service. YouTube: 13.4% of TV viewing, six consecutive months as the single largest distributor, ahead of Netflix at 8.8%. Sutton’s streaming analysis has no slot for a player that dominates the screen without trying to be a streaming service. Maybe YouTube is just a different product category that happens to show up on the same device?
Netflix is spending like a company that’s losing. $3B in 2014 to $18B in 2025, accelerating, no plateau, in a market it already dominates with 29.5% margins. In Sutton, the leader’s investment scales with market size, but Netflix’s spend is outpacing the market’s revenue growth. Maybe Netflix is just finding the next Kpop Demon Hunter?
The streaming leader named sleep as the competitor. Hastings 2017 shareholder letter: “We’re competing with sleep, and we’re winning.” The best-informed player in the industry, writing to shareholders, defined the competitive set as anything that takes primary cognitive bandwidth, not Disney+, not HBO. Maybe that’s just CEO just very cringe and wrote some BS for a shareholder letter?
Gen Z churns out of streaming at significantly higher rates. Six-month cancellation rates well above older demographics, tracked consistently across multiple survey sources. Sutton predicts mid-sized players churn, not entire demographic cohorts. Maybe young people are just brain rotted by Tung Tung Tung Sahur?
None of these alone is damning. But five separate patches is a lot of patches…kinda sus.
At some point the simpler move is to ask whether streaming is inside something, and that something is pulling the strings.

The market of markets
Take a step back. Strip the business language. What is a market?
From first principles: a set of agents competing for a shared resource through recursive investment. That’s it. In a non-commoditized market, agents invest, the threshold rises, agents invest against the new threshold. The system converges to a stable structure. Sutton formalized this for firms inside an industry. But nothing in that definition requires the agents to be firms.
If a market is “agents competing for a shared resource through recursive investment,” then markets themselves can be agents. Markets competing for a shared resource through recursive investment. A market of markets.
It’s the same exact recursive structure operating at a different level. And it’s exactly what second-order cybernetics describes: a system whose agents are themselves systems, each one’s behavior reshaping the field every other one acts on. The framework doesn’t care whether the agents are firms, industries, or anything else. It cares about the structure.
| Firm-level (classical Sutton) | Form-level (this paper) | |
|---|---|---|
| Agent | Firm | Industry (form) |
| Shared resource | Consumer spending in one industry | Primary attention across industries |
| Investment | Content spend, advertising, R&D | Aggregate form-level content/tech investment |
| Threshold | Set by rivals inside the industry | Set by rival forms outside the industry |
| Convergence | N firms survive (concentration lower bound) | N forms survive (form-level lower bound) |
| What gets squeezed | Mid-sized firms | Sub-scale forms |
Same structure. Just zoomed out.
So what’s the shared resource at the form level? My answer is Primary Attention. The cognitive bandwidth left after sleep, work, and ambient consumption. Two to three hours a day. There’s a hard ceiling, and it’s zero-sum. You can’t multitask it. Everything that demands your eyes and your full cognition draws from the same pool: streaming, YouTube, TikTok, gaming, reading.
“Attention economy” is a cliché. Everyone says it. But almost nobody describes the mechanism by which the meta-market actually pulls the strings of each sub-market.
The mechanism is Sutton’s escalation running at the form level: aggregated-firms in forms invest to hold attention share, the threshold rises, sub-scale forms get squeezed, and the squeeze transmits downward as an exogenous force on the firms inside each form.
But can we prove streaming actually competes in this meta-market?
The claim isn’t obvious. Streaming could be a self-contained industry whose constraint sits entirely inside itself. We need strong evidences to prove it. I came up with this frame work from forensic investigation.
| type | Sub-bucket | Evidence |
|---|---|---|
| Testimony | Self | Ellison 2 Mar 2026 investor call: “we plan to put the two services together… gives us a little over 200 million direct-to-consumer subscribers.” Frame is DTC engagement, “compete with leaders in space” |
| Adverse same-industry | Hastings 2017 shareholder letter: “competing with sleep, and we’re winning.” Netflix internal metrics center on watch hours | |
| Adverse cross-form | Meta Q3 2025: Reels annualized revenue ~$50B, attention competition with streaming as explicit metric. TikTok Creator Fund 2020 ($200M) → Creativity Program 2023 (scale upgrade). YouTube creator payouts >$32B in 2024 | |
| Behavioral | Self / same-industry | Netflix content $3B (2014) → $18B (2025). Disney DTC ~$14B/yr. WBD/Max ~$12B/yr. Industry total $140B (2020) → $210B (2024) |
| Cross-form pricing escalation | Disney+ Premium $6.99 → $18.99 (+172%, 2019–25). Hulu +58%, HBO Max +40%, P+ +30%, Peacock +60%. Game Pass Ultimate +100%. All forms double-digit-percent consumer pricing increases over 6 years | |
| Self-behavior pivoting | Paramount 4 restructurings in 10 years; WBD 3 mega-deals in 5 years | |
| Structural | Demographic-behavioral | Gen Z prefers short-video over streaming (Deloitte 2025). Gen Z 6-month SVOD cancellation rate notably higher. Nielsen Gauge: streaming +71%, broadcast −21%, cable −39% (2021–25) |
| Human nature | 16 hours awake, 2–3 hours primary-attention cognitive cap. US household average 4 SVOD subs at $69/month stack spend (budget cap). Winner-take-most exponential ranking | |
| Form-intrinsic ceilings | Pre-iPhone smartphones (Symbian, BlackBerry, Windows Mobile) escalated within form for years before being substituted; Nokia $7.5B/year R&D in 2010 produced no path forward. Spotify capex $135M (2019) → $6M (2023) |
Those all combined, is beyond resonable doubt.
Deep dive: the nuclear arms race for attention
Utility function
Here we define U = perceived entertainment value per unit of time within a person’s primary attention slot. Aggregate of content quality, algorithmic recommendation, stimulation, personalization, and access. Each form offers a specific U for each individual at each moment. People pick the highest U available. Primary attention can’t be split, so it’s winner-takes-all at the individual level and winner-takes-most across demographic-behavioral groups.
Three snapshots
For the sake of convenience, we normalized U as U-score on a scale of 0 to 10. U, as we trivially aware, shall monotonically increase with higher Capex. However, realistically U might go down, like a very high price for a very lame set of shows.
Also note that in the Capex-U curve we normalized Capex as spending equivalent: late market entrance means you can acquire talent and use existing experience to get to the same level of U with lower actual spending!
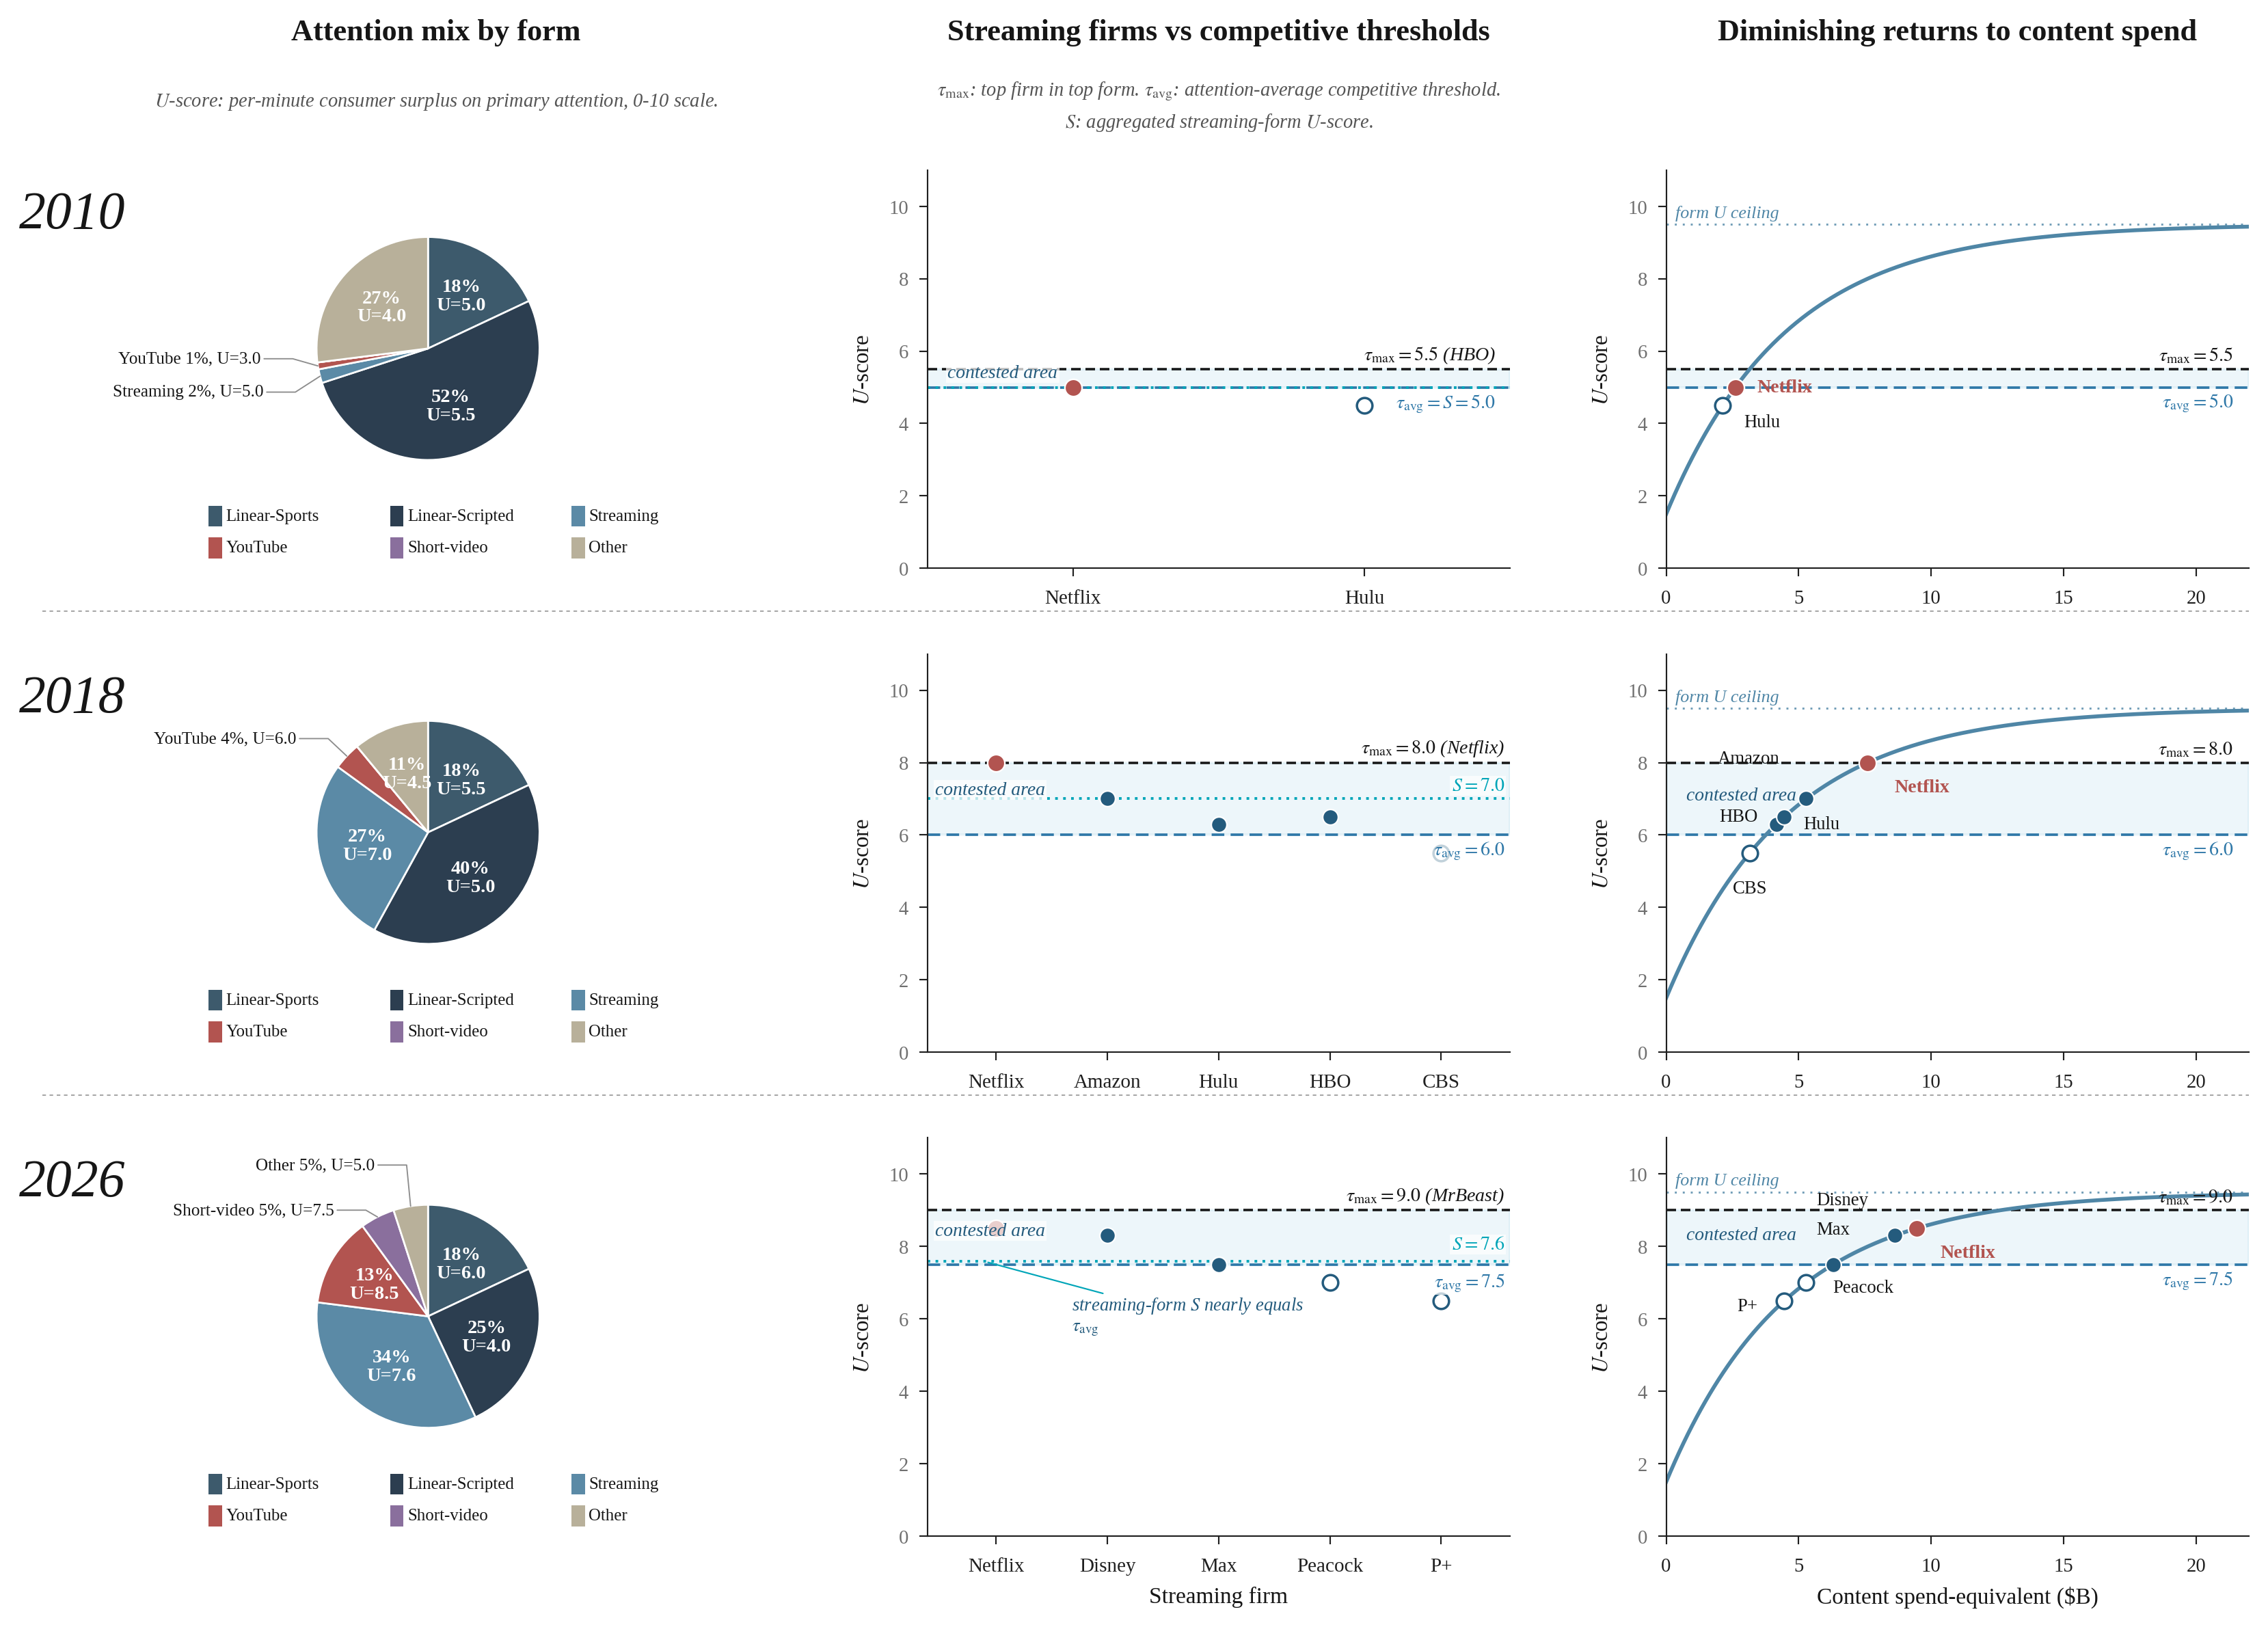
Snapshot 1: 2010. Linear TV owns 70% of attention. YouTube is just a baby. Streaming doesn’t exist as a form. Netflix is a DVD company. The threshold to enter is U = 5.0, just need to beat linear.
Snapshot 2: 2018. Streaming arrived. Netflix dominant at $8B. YouTube has real U now. The threshold has risen to 6.0–7.0. Disney+, HBO Max, Apple TV+, Peacock, Quibi all see the gap above the threshold and pile in.
Snapshot 3: 2026. YouTube is tier 1 now. TikTok owns Gen Z. Linear collapsed, streaming plateaued. The threshold is now 7.5. Netflix still leads the streaming form at 8.5. Disney barely clears. Max sits on the line. Peacock and P+ are below. The Capex-U curve has entered diminishing return phase. The gap that invited entry in 2018 has closed.
The arms race in one number
Notice how the average U-score keep escalating, τ_avg went 5.0 → 6.0 → 7.5. The ceiling of the form didn’t move but the arms race for attention raises the floor. The actual contested zone - a seat on the table, keep raising as well, and the firms inside it are spending more every year to stay where they are. Up or out!

I have a better question…
So what? Why should anyone outside streaming care?
Because streaming isn’t the point. Streaming is just the case where you can see the mechanism: capex public, subs public, attention measured, every variable in the open. So we get to take a peek.
The mechanism itself is everywhere. Once you see it, you carry a different question into every market:
Am I actually competing with the people I think I’m competing with?
Two kinds of markets
Locked-form. One form factor owns the need.
Open-form. Need is stable but form factor isn’t.
They are convertible!
Most industries are locked-form: phones. Everybody needs a phone, no substitute. Watch can’t replace it. Apple fights Samsung inside the form.
But what if Apple Glass arrives? Suddenly glasses become a phone substitute. Different form factor, same need. The market becomes a market of markets: people picking across forms to satisfy one need. Phone goes from locked-form to open-form overnight.
The cleanest open-form case other than attention is food. People need to eat. Doesn’t matter if it’s Uber Eats, frozen pizza, instant ramen, dine-in: they all competing on the same need: highest U for an individual. Watch what happened to instant ramen after delivery apps scaled. Very similar logic as streaming: tied to human nature, hard ceiling, every form competing for the same slot. (Caveat is they scale way differently)
Once you identify you’re in an open-form market, the questions change. What can you do at the threshold? Is your current strategy short-sighted? Are you involuting within your segment, or are you uniting with your form to compete against another form?
Case study - Kodak
1990. Locked-form: photographing = film. Chemical film owns the entire need. No substitute. Kodak holds 90% US film share and 85% camera sales. Strategy is intra-form: defend film, improve film, distribute film.
2000s. Open-form: photographing = film vs. digital. Two form factors competing for the same need. Digital cameras explode from 4.5M units (2000) to 28.3M units (2007). Kodak still playing the locked-form game. Dies.
2015 onward. The open-form splits into two locked-form sub-markets:
- Casual shooting: smartphone wins, becomes its own locked-form. Phone absorbs the segment entirely. Apple and Samsung fight inside it.
- Professional shooting: real cameras retreat here, becomes its own locked-form. Sony, Canon, Nikon dominate. Bigger CMOS, real ergonomics, real lenses.
The boundary between the two sub-markets is a U-curve ceiling. Phones keep pushing into professional market with Capex: computational photography, multi-lens stacks, larger sensors every cycle. However, as we constructed in the Capex-U curve, they hit a ceiling the form can’t cross. A small CMOS in a slab body has a lower U than a real camera for a real shoot, and the gap doesn’t close no matter how hard Apple pushes.
What the $81B actually buys?
Merger buys two structurally different things.
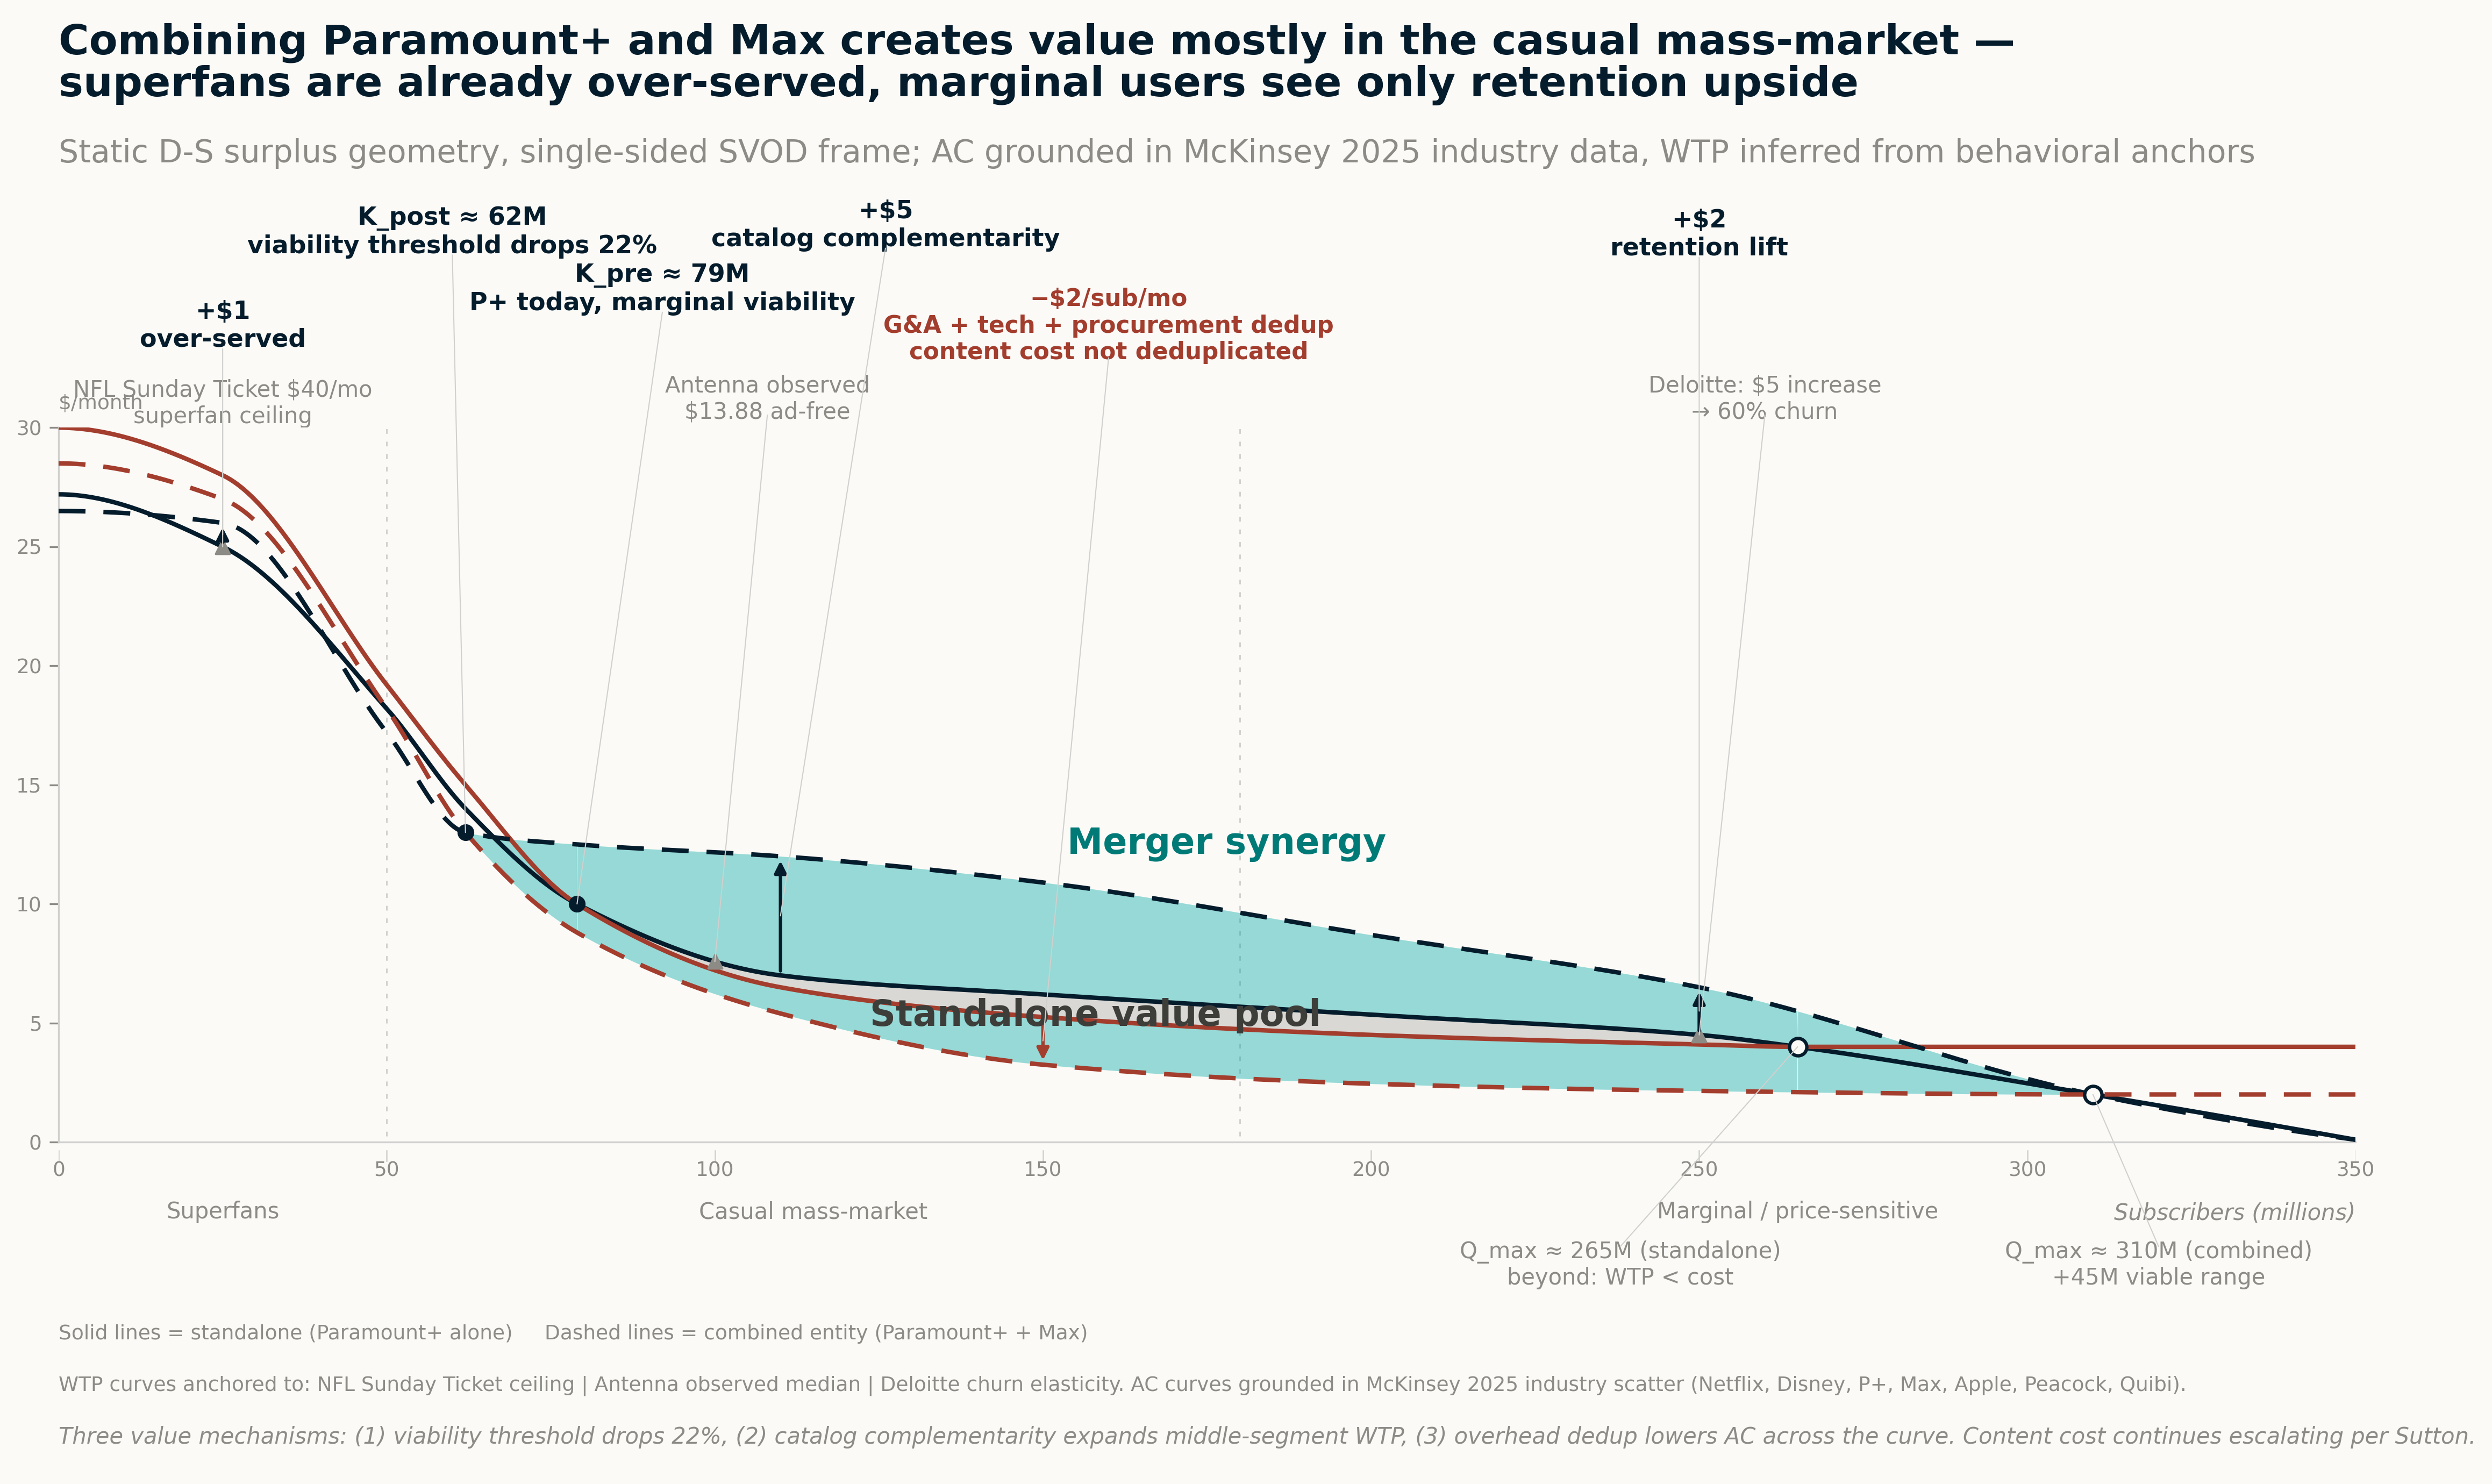
First: static cost elimination. Combined ~211M subs, less 7.6M US household-level overlap (Antenna), unique global ~200–205M. Per-sub content cost trajectory toward $65–70.
Second: acquirer-specific stuff. Skydance-specific cost of capital, cable network disposal optionality, theatrical consolidation between Paramount Pictures and WB.
Third: a viable seat at the form-level table. Standalone P+ and standalone Max each face existential pressure under form-level threshold; merged, they hold one viable tier-2 seat with capital structure to sustain $15–18B/year content investment through escalating cycles. The price of the ticket to the nuclear arms race for attention.
Caveat upfront: I’m not an economist. I’m not a financial analyst. The numbers below are my best educated guesses from the public data. If you push me on any individual line, I am for the most part hand-waving. The point of the waterfall is to show that the standard synergy framework cannot reach $81B no matter how generously you build it, and that something else has to be in the deal.
| Component | $B (mid) | Range | Build |
|---|---|---|---|
| Static cost elimination | ~$50 | $40-60 | $6B run-rate, 3-yr ramp, perpetuity at 14× (8.5% WACC, 1.5% g), less integration |
| Acquirer-specific extraction | ~$15 | $10-25 | WACC differential + cable disposal + theatrical consolidation |
| Participation option | ~$20 | $10-30 | Seat NPV |
| Strategic value (mid) | ~$85 | $60-115 |
The math is mathing now!
What this lets us see
The static cost elimination line could be $40B or $60B depending on integration execution. The acquirer-specific line could be $10B or $25B. But those doesn’t matter for the argument. Even at the high end, it doesn’t reach $81B.
The participation option is the only line that has to be there for the math to clear, and it’s the only line standard frameworks don’t have a slot for.
Prediction and falsifiers
No theory is good without proving it’s predictive power. Let’s see if it’s gonna work, check back in 2028!
| Prediction | What confirms | What falsifies |
|---|---|---|
| Cross-form M&A appears. Streaming buys gaming, gaming buys short-video, bundlers absorb multiple forms. | At least 2 cross-form deals >$5B in 24 months. Microsoft/Activision (2022) and Amazon/MGM (2021) are precedent. | No cross-form moves in 24 months! Form boundaries hold, frame is just Sutton with extra labels. |
| Synchronized pricing escalation across forms. Streaming, gaming subscription, music, podcast premium, cloud storage raise in same quarter at similar magnitude. | Two or more forms raise prices within one quarter, 10%+ each, in 2026 or 2027. | Price moves stay form-internal and uncorrelated in timing. |
| Form-internal strategic action accelerates post-close. Other players’ behavior changes because the P+/WBD deal happened. | Comcast/Peacock makes explicit strategic reveal (cut, sale, or pivot) within 24 months. Apple TV+ disengages further. Netflix re-evaluates acquisition discipline. | No visible acceleration in 12 months → reflexivity claim fails. |
Rediscovery of second-order cybernetics
We had briefly mentioned this above: Market is essentially agents act inside a system, every action reshaping the field every other action is taken on.
This shape has a name. Second-order cybernetics. Wiener, von Foerster, Maturana, Ashby, 1940s–1980s. General theory of systems where the observer is inside the system being observed.
Cybernetics launched as more of a philosophical program than a working framework. Made some wild claims. The technology of the time couldn’t deliver on any of them. State observation bottlenecked at quarterly releases. Models stuck at linear systems. Recursive observation impossible to operationalize. Tacit knowledge couldn’t be extracted without agents articulating it themselves.
The framework was describing phenomena it couldn’t measure, model, or compute. Business academia stopped reading it around 1990.
AI fills exactly those gaps. LLMs convert unstructured organizational signal into measurable state. Neural nets expand model classes from linear to arbitrary. Multi-agent systems are recursive observation as engineering. The pieces that were premature in 1970 are operational substrate in 2026.
The puzzle pieces come together
Business academia spent thirty years rediscovering pieces of this independently: each fragment under a different name, in a different field, bottlenecked by the same missing infrastructure. Nobody connected them. Lay them out and the unifying frame is obvious:
| Second-order cybernetics concept (1940s–1980s) | Business rediscovery | Domain / key figures |
|---|---|---|
| Observer in the system, non-trivial machine (von Foerster) | Reflexivity: participant expectations and fundamentals co-produce each other | Finance, Soros |
| Constitutive observation: describing changes the described | Performativity: economic theory shapes the markets it claims to describe | Economic sociology, Callon, MacKenzie |
| Enaction: action produces environment (Maturana, Varela) | Enactment / sensemaking: organizational members construct their environment through action | Organizational behavior, Weick |
| Operational closure: system maintains its own boundaries through its own operations | Dynamic capabilities: continuous environmental sensing reshapes firm and environment | Strategy, Teece |
| Autopoiesis: system produces its own components | Ecosystem co-construction: players entering reshape the game tree | Strategy, Adner; Brandenburger-Nalebuff |
| Eigenform: stable fixed point of recursive operation | Endogenous sunk cost: ESC escalation produces concentration lower bound | IO, Sutton 1991 |
| Recursive coupling: state ↔ action irreducibly coupled | Endogenous market structure / MPE | Dynamic IO, Ericson-Pakes, Etro |
Each cell on the right is a respected, well-cited body of work. Each one is one face of the same underlying structure.
Worth exploring more!
Closing
Just zoom out a little bit more bro trust me bro.
Appendix
Deal finance anchors
| Item | Value |
|---|---|
| WBD unaffected price (10 Sept 2025) | $12.54 |
| WBD pre-deal market cap | ~$30–31B |
| Paramount bid (per share) | $31.00 cash |
| Equity value | ~$81B |
| Enterprise value | $110.9B |
| Net debt assumed | ~$30B |
| New debt facilities | $49B (originally $54B bridge) |
| Equity commitment | $43.6–47B (Ellison + RedBird + PIF + ADIA + QIA + LionTree) |
| Premium vs unaffected | 147% |
| Implied EV / 2026E EBITDA synergized | 7.5× |
| Implied EV / 2026E EBITDA pre-synergy | ~12.7× |
| Pro forma net debt at close | ~$80B |
| Net debt / Adj EBITDA at close | ~7.0× pre-synergy / 4.3× synergized |
| Synergy run-rate target | $6B (3-year ramp) |
| Netflix bid (rejected) | $27.75/sh, $72B equity, $82.7B EV |
| Bid spread (EV) | ~$28B |
AVA pool composition (estimate)
| Tier | Players | Approx share of total algorithmic video attention |
|---|---|---|
| Tier 1 algorithmic hybrid | YouTube | 30–35% (growing) |
| Tier 2 curated SVOD | Netflix, Disney, P+/Max merged, Peacock, Apple TV+ | 20–25% (declining) |
| Pure short | TikTok, Reels, Shorts (cross-counted) | 20–25% (growing) |
| Linear residual | Cable, broadcast | 15–20% (declining) |
Streaming player data: Netflix 325M / $18B / 29.5% / $55. Disney DTC 196M / $14B / 5.3% / $71. WBD/Max 132M / $12B / ~8% / $91. P+ 79M / $6B / 1–3% / $76. Apple TV+ 45M+ / $5–7.5B (cut to $4.5B in 2024) / −20–25% / $111–167. Peacock 41M / $5B / −15–20% / $122. Industry content $140B (2020) → $210B (2024). Parrot cross-affinity 86.7%. Antenna US household-level overlap 7.6M (14% of combined pool).
Cybernetics references: von Foerster Understanding Understanding (2003), Observing Systems (1981, eigenform essays). Maturana & Varela The Tree of Knowledge (1987). Ashby An Introduction to Cybernetics (1956). Wiener Cybernetics (1948). Beer Brain of the Firm (1972). Soros The Alchemy of Finance (1987). MacKenzie An Engine, Not a Camera (2006).
IO references: Sutton Sunk Costs and Market Structure (1991), Technology and Market Structure (1998), Marshall’s Tendencies (2000). Berry & Waldfogel (2010). Bronnenberg, Dhar & Dubé (2010 QME). Etro 2014 (JES). Anand The Content Trap (2016). Andrade, Mitchell & Stafford (2001) on M&A premium-sharing.
Other: Brandenburger & Stuart 1996. Schumpeter 1942. Teece 1997. Aguiar & Waldfogel 2018. Bakos & Brynjolfsson 1999. Kashyap-Mir-Iyer 2017.